Top page /
Overview & Download /
Basic usage /
Sample data
Version 2.5 /
Version 2.7 /
Bug info /
Version history /
Q & A /
Donation
Top page /
Overview & Download /
Basic usage /
Sample data
Version 2.5 /
Version 2.7 /
Bug info /
Version history /
Q & A /
Donation
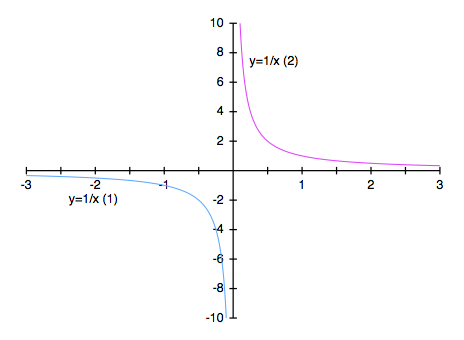
Q How to treat function's discontinuities (Oct. 18, 2015)A. On the function y=1/x, the output y goes to ±∞ around the point of x=0. This curve obviously ends up including discontinuous points. (As a result, the discontinuous points are forced to connect with a line.) To prevent this, Use serial parameters =[,] in your expression as bellow, and calculate the function with different domains that are divided to two.
%label "y=1/x (1)":"y=1/x (2)" 
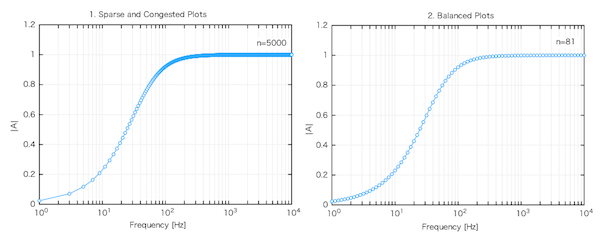
Q How to calculate equally arranged x data for log scale axis (Feb 3, 2012)A. When you create a frequency characteristic graph, a log scale should be applied to the x axis because x data range widely, for example, from 0 to 1M (106) Hz. In the case of graph creation from expressions, if you assign the frequency x to the loop variable like the expressions below (x=<1:10000:2>), an unbalanced graph, which has x data ranging sparsely in the lower frequency and densely in the higher, will be created. (Since the x data are calculated at regular intervals, they appear like that on a log scale.) And, the number of data in this example becomes as many as 5000 points (It becomes 50000 points if the maximun value increases up to 105.)
! Frequency characteristic for RC high pass filter (C=470μF, R=8 Ω) You should assign not the frequency x but the exponent n of x=10n to the loop variable like the expressions below (n=<0:4:0.05>).*1 Hereby, you can calculate equally arranged x data because log(x) has a linear relation with n.*2 And of course, you can suppress the increase of the number of data (81 points in this example).
:
*1
*2 
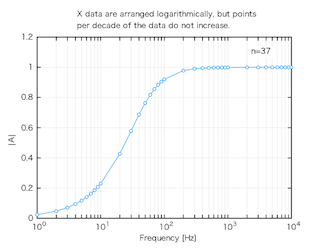
(Added on Feb. 24 '12) For your reference, the following is an example in which the points per decade do not increase although x data are arranged logarithmically.
R=8@ 
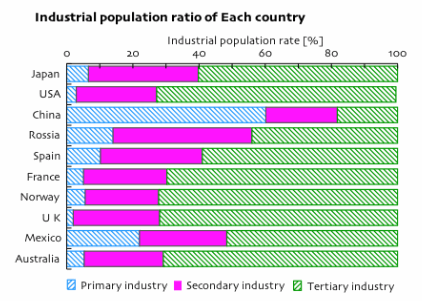
Q How to create a laid bar graphA. From version 1.5, "Piled bar type graph" and "Axes rotation to right 90 degree" are available as new functions. By using these functions, a laid bar graph can be created easily. The steps to create it are as follows.
In addition, if you want to insert "return" into a string of the x labels (if you want to display it with multiple lines), you have to insert "space" at the position to insert "return" and bind the whole character string with double quotation marks (" ") at the stage of data preparation. (Otherwise, "space" will be recognized as a delimiter.) And after the creation of the graph, you should choose "Multiple lines" at the section "Axis label/Option" on the "Axis" pane of the "Graph Attributes" panel. 
Q How to insert "space" into a data label
A. Data labels can also be set in the "Disp…" sheet window without using the "L" header. After checking syntax of data, open the "Disp…" sheet window and replace the default data labels with the desired ones that include "space" (U+0020). In addition, you can change data labels on the "Symbol/Line" pane of the "Graph Attributes" panel after the creating of a graph. (Rivised on Aug. 02 '09) On the next version (1.8), you will be able to include "space" into a data label by binding a data labe with double quotation marks (" ") in the "L" header or the "%label" header. Q About a syntax error the reason of which cannot be unknownA. ByeGraph cannot visualize invisible ( whitespace ) characters on its editing field. So, when an invisible ( whitespace ) character, which is not allowed, is used at an improper position, a syntax error will occur at that point even if the syntax seems to be correct. (Among whitespace characters, you can only use "space" (U+0020) and "tab" (U+0009) as a delimiter. For example, if a full-width space or a non-breaking space ( in HTML, U+00A0) is put on a delimiter's position, that will cause a syntax error.) If you encounter an unknown error in the data of the editing field, use an editor application, which can display invisible characters to clear the above suspicion, in order to check whether those futile characters are included in the data. (Rivised on Nov. 08 '08) From version 1.6, you will be able to convert non-breaking spaces ( in HTML, U+00A0) to ordinary spaces(U+0020) using "Filtering process in reading data". This function is usable in reading data through the "Add…" button, Drag & Drop and Copy & Paste. Q About an error due to mismatches of file encoding
A. When data are read from a plain text file, an encoding error may occur (reading data may end up failing) if the file encoding is not the same as its current setting on the Preferences panel. Or even if reading data is passed, the data may not be displayed correctly. As long as you open data files using other application such as an editor and do drag & drop or copy & paste from there, problems with encoding will not be caused. (Revised on Mar.15 '09) From version 1.7, Automatic detection for the type of file encoding will be usable. Q About document's extensionA. ByeGraph's documents have several different extensions according to their version number.
* The same extension will be used on the version 1.6 or later ByeGraph provides upper compatibility in reading its documents. |