Top page /
Overview & Download /
Basic usage /
Sample data
Version 2.5 /
Version 2.7 /
Bug info /
Version history /
Q & A /
Donation
Top page /
Overview & Download /
Basic usage /
Sample data
Version 2.5 /
Version 2.7 /
Bug info /
Version history /
Q & A /
Donation
New Features in ByeGraph 2.5 |
1. Dividing Data (Data segment)Version 2.7 / In the data part, you can divide data in the same row into multiple data blocks by inserting the word “#break”. These sets of data which were divided are called “Data Segments”. Here is an example that has tree data segments into which X, Y2 and Y2 row data were divided. (The part of “:” is omitted.) The number of rows for each data segment must be the same as the others.
! A B A benefit of using data segments is to be able to regard a piece of row data as independently multiple data. For example, this graph shows that a piece of row data consists of 3 data segments that indicate nonconsecutive data. (Those cannot be connect each other.) Like this graph, you can set deferent attributes, such as line type and colors, for each of data segment.
(An example graph for multiple data segments) 2. Serial ParameterSerial parameters are specified by =[,,,] and allowed to hold up to 16 elements. The deference between the serial parameter and the normal parameter is illustrated below.
If you use serial parameters, a pair of x and y data trains is outputted repeatedly up to the same number as the parameters. Serial parameters cannot be used together with normal parameters. As a result, x and y data trains outputted from expressions including serial parameters are equal to “Data Segments” that are used in the “Data”.
By using serial parameters, the following applications become newly possible. As an example which is one of the three applications above in which serial parameters are used, the followings are expressions to create a graph (illustrated below) of quadratic curves which have two different domains of definition by shifting the range of the variable x.
oft=[1,-1] @
3. Multiple Graphs
By choosing the “Multi” item from the Graph size pop-up menu on the Source data setting panel, you can create a “Multiple Graphs” that arranges multiple graphs vertically. About the graph unit for Multiple Graphs, which means which data it consists of, you can specify it by choosing one from The X axis of each graph in multiple graphs uses the same scale as the others. And The Y axis uses either Y1 or Y2 scale alone, or both. And, depending on the graph type you want to create, you cannot choose “Multi” graphs for the graph.
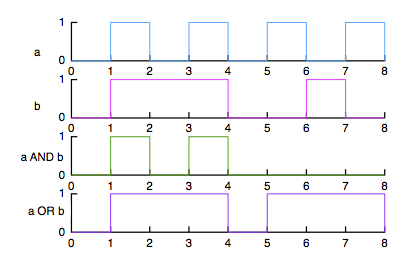
(An example for Multiple graphs) 4. [Expressions] Logical operators, Relational operatorsAs operators which can be used in expressions, three kinds of logical operators are newly added: &(AND), |(OR) and \(NOT). (\ is the monomial operator. & and | are binomial operators.) And in the earlier versions, although relational operators have been allowed to inhabit only inside the “test” expression of the switch(“test”,A:B) function, the restriction is completely removed. The order of priority among operators is as follows. '|' << '&' << '>,<,≥,≤,=,≠' << '+,-' << '*,/' << '^' << '\' The following expressions is an example for logical calculation using logical operators.
%data (Calculation results)
0 0 0 0 0 
5. Others
|