Top page / Overview & Download / Tutorials / Bug info
Tutorials
|
1. Calculate expressionsWith CalcLoop Plus, you can calculate expressions repeatedly while making the value of the loop variable change.
%nograph In the expressions above, %nograph is one of expression headers, and is used when you want to output the results from the expressions not as a graph but as a numerical list. (Without %nograph, they are outputted to both.) And x is the loop variable and its range is specified in the form of "=<Min:Max:Step>". And parameters are specified in the form of "={,}".
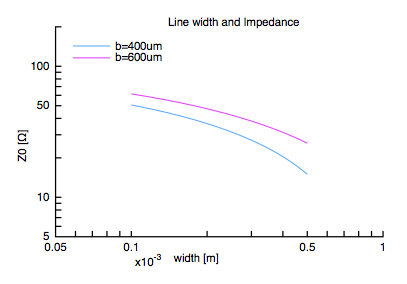
1.000000e-04 50.67577 61.55554 The values of the loop variable x are outputted as x data to the first column. To the second and third columns, the values of the variable y are outputted as y data up to the same number as parameters. 2. Output results as a graphNext, let's try to make a graph by using the former expressions again.
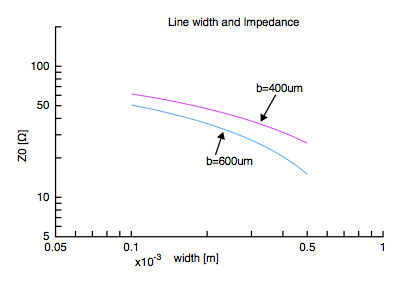
If you have the %nograph header, headers related graph will be ignored. the %rangelog header is used for setting a graph axis' scale to log. (The first parameter stands for the kind of an axis, and the second parameter does an axis range which consists max and min values. If it does not have the second parameter, the range will be determined automatically.) The %axislabel header is used for specifying an axis label the kind of which is x, y or y2 axis. The %label header is used for specifying data labels.
%rangelog x (5e-5:0.001)

Whether legends are displayed or not in the initial stage is determined depending on a setting in the Preferences panel. And the kind of lines created by the "Line" tool can be set in the Preferences panel. 
3. An example for file reading functionIf you make use of a file reading function in expressions, you can give some calculation processes to raw data which can be got from experiments and so on.
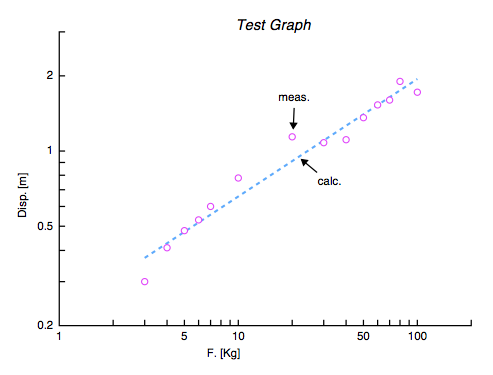
3 0.30 Except for using Drag &am; Drop, from the file read button or through the %external header, you can specify a particular file as source data for file reading functions.
%format d f Specify the row number of the source data for the argument of the fread function. Since the fread function can control(*) the loop variable, which means it generates loop of the same number as the source data's rows, you need not prepare the range specification (=<::>) of the loop variable. In this example the first column of the source data is assigned to the loop variable x, and the second column is assigned to the variable y. (*) There are two types of file reading functions. One is the fread function that reads data sequentially, the other is the fread2 function that reads them at random. The fread function can only control the loop variable. In this example theoretical values from calculation are plotted on the graph in addition to the source data. To do it, the variable y is substituted to the variable z, which contains theoretical value, and the output of the fread function, which comes from the source data, by using the parameter specification "={,}". The %symbol header is used for specifying combinations of symbol and line. And the types of symbols and the types of lines are specified by the %symboltype header and the %linetype header respectively.

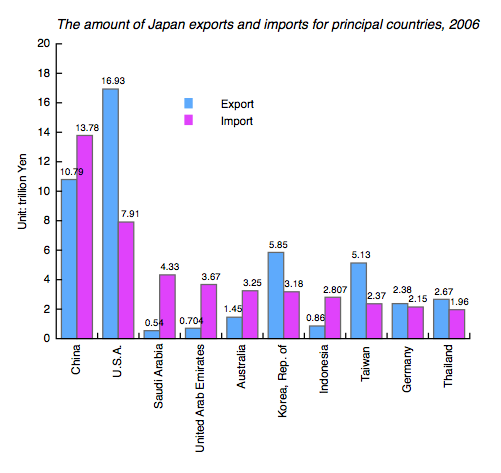
4. Read text strings and create bar graphUsing file reading functions makes reading strings data also available. (But for making a graph, the strings that is the output of the function has to be assigned to the loop variable x.) In this example you will try to make a bar graph which has x axis labels generated from the strings.
China 10794 13784
%xstrings a To display x axis labels as strings, the %xstrings header is required. The parameter to the header stands for a display type of x axis labels. (The parameter "v" means the labels are laid out vertically.) The %format header is used for specifying data formats when the results are outputted to the List pane. The parameter "s" means strings, and "f" means real values. (The others is that "d" is integer values, "y" is integer values divided by every 3 figures, and "e" is real values with exponential.) To make a bar graph, check the "Use Bar for X strings graph" button in the Preferences panel. And if you check the "Value on Bar", the values of y data are plotted around bars.

|